Up

Graphing single-variable inequalities

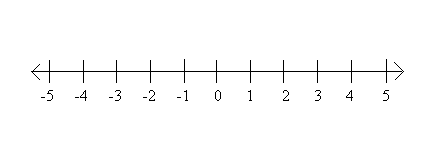
There are just a few important concepts that you must know in order to graph an inequality. Let’s review a number line.
Graphing-single-variable-inequalities-1

The negative numbers are on the left of the zero and the positive numbers are on the right.

Example 1


\(r >  - 5\)


This is read as “r is greater than -5.” This means it includes all numbers greater than, or to the right, of -5 but does not include -5 itself. We will have to show this by using an open circle and having the arrow shoot out to the right.


Graphing-single-variable-inequalities-2

Example 2


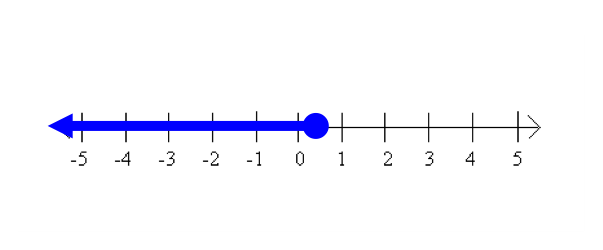
\(x \le 0.4\)


This is read as “x is less than or equal to 0.4.” This time we include the 0.4 by using a closed circle and the arrow will shoot out to the left. The number 0.4 is in between the 0 and the 1 on a number line.
Graphing-single-variable-inequalities-3

Example 3


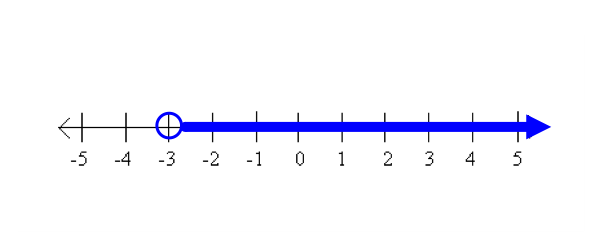
\( - 3 < p\)


Be careful with this one! Since it is backwards, it is read as “p is greater than -3.” You always read an inequality starting with the variable. This means that the graph will have an open circle and will shoot out to the right.
Graphing-single-variable-inequalities-4

Here is a summary of the important details in graphing inequalities.

 Make sure you read the inequality starting with the variable!


“greater than” or “greater than or equal to”        – arrow shoots out to the right

“less than” or “less than or equal to”                 – arrow shoots out to the left

will have open circles
\( \le \) and \( \ge \) will have closed circles


Below you can download some free math worksheets and practice.


Downloads:
3334 x

Draw a graph for each inequality.

This free worksheet contains 10 assignments each with 24 questions with answers.

Example of one question:

Inequalities-Graphing-single-variable-inequalities-easy

Watch below how to solve this example:


Downloads:
2973 x

Draw a graph for each inequality.

This free worksheet contains 10 assignments each with 24 questions with answers.

Example of one question:

Inequalities-Graphing-single-variable-inequalities-medium

Watch below how to solve this example:


Downloads:
3140 x

Draw a graph for each inequality.

This free worksheet contains 10 assignments each with 24 questions with answers.

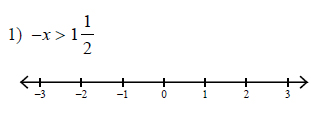
Example of one question:
Inequalities-Graphing-single-variable-inequalities-hard

Watch below how to solve this example:


Facebook PageYouTube Channel

Algebra and Pre-Algebra

Beginning Algebra
Adding and subtracting integer numbers
Dividing integer numbers
Multiplying integer numbers
Sets of numbers
Order of operations
The Distributive Property
Verbal expressions
Beginning Trigonometry
Finding angles
Finding missing sides of triangles
Finding sine, cosine, tangent
Equations
Absolute value equations
Distance, rate, time word problems
Mixture word problems
Work word problems
One step equations
Multi step equations
Exponents
Graphing exponential functions
Operations and scientific notation
Properties of exponents
Writing scientific notation
Factoring
By grouping
Common factor only
Special cases
Linear Equations and Inequalities
Plotting points
Slope
Graphing absolute value equations
Percents
Percent of change
Markup, discount, and tax
Polynomials
Adding and subtracting
Dividing
Multiplying
Naming
Quadratic Functions
Completing the square by finding the constant
Graphing
Solving equations by completing the square
Solving equations by factoring
Solving equations by taking square roots
Solving equations with The Quadratic Formula
Understanding the discriminant
Inequalities
Absolute value inequalities
Graphing Single Variable Inequalities
Radical Expressions
Adding and subtracting
Dividing
Equations
Multiplying
Simplifying single radicals
The Distance Formula
The Midpoint Formula
Rational Expressions
Adding and subtracting
Equations
Multiplying and dividing
Simplifying and excluded values
Systems of Equations and Inequalities
Graphing systems of inequalities
Solving by elimination
Solving by graphing
Solving by substitution
Word problems